Data Visualisation
What is Data Visualisation?
-1.png)
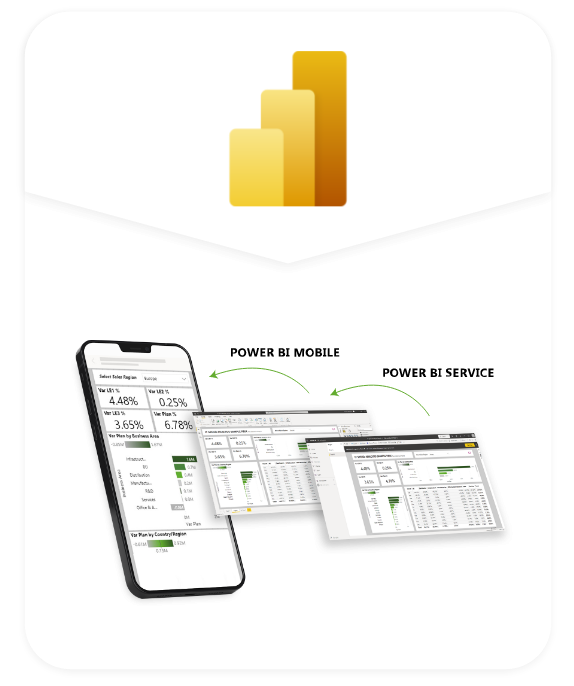
Data visualisation is the representation of data through use of “visuals”. These include charts, graphs, tables, indicators and other visual elements that convey useful information about an underlying process or situation.
Analytics is the art of using data visualisation to tell a story about the data, to derive insights. The way a data analyst tells the story with data allows the report viewer to understand:
- What happened (descriptive analytics)
- Why something happened (diagnostic analytics)
- What is the likelihood of something happening (predictive analytics)
- What actions may help to ensure something happens (prescriptive analytics)
- What might happen if something changes (cognitive analytics)
Therefore, data visualisation and analytics play a major role in driving effective business decisions.
Our Approach
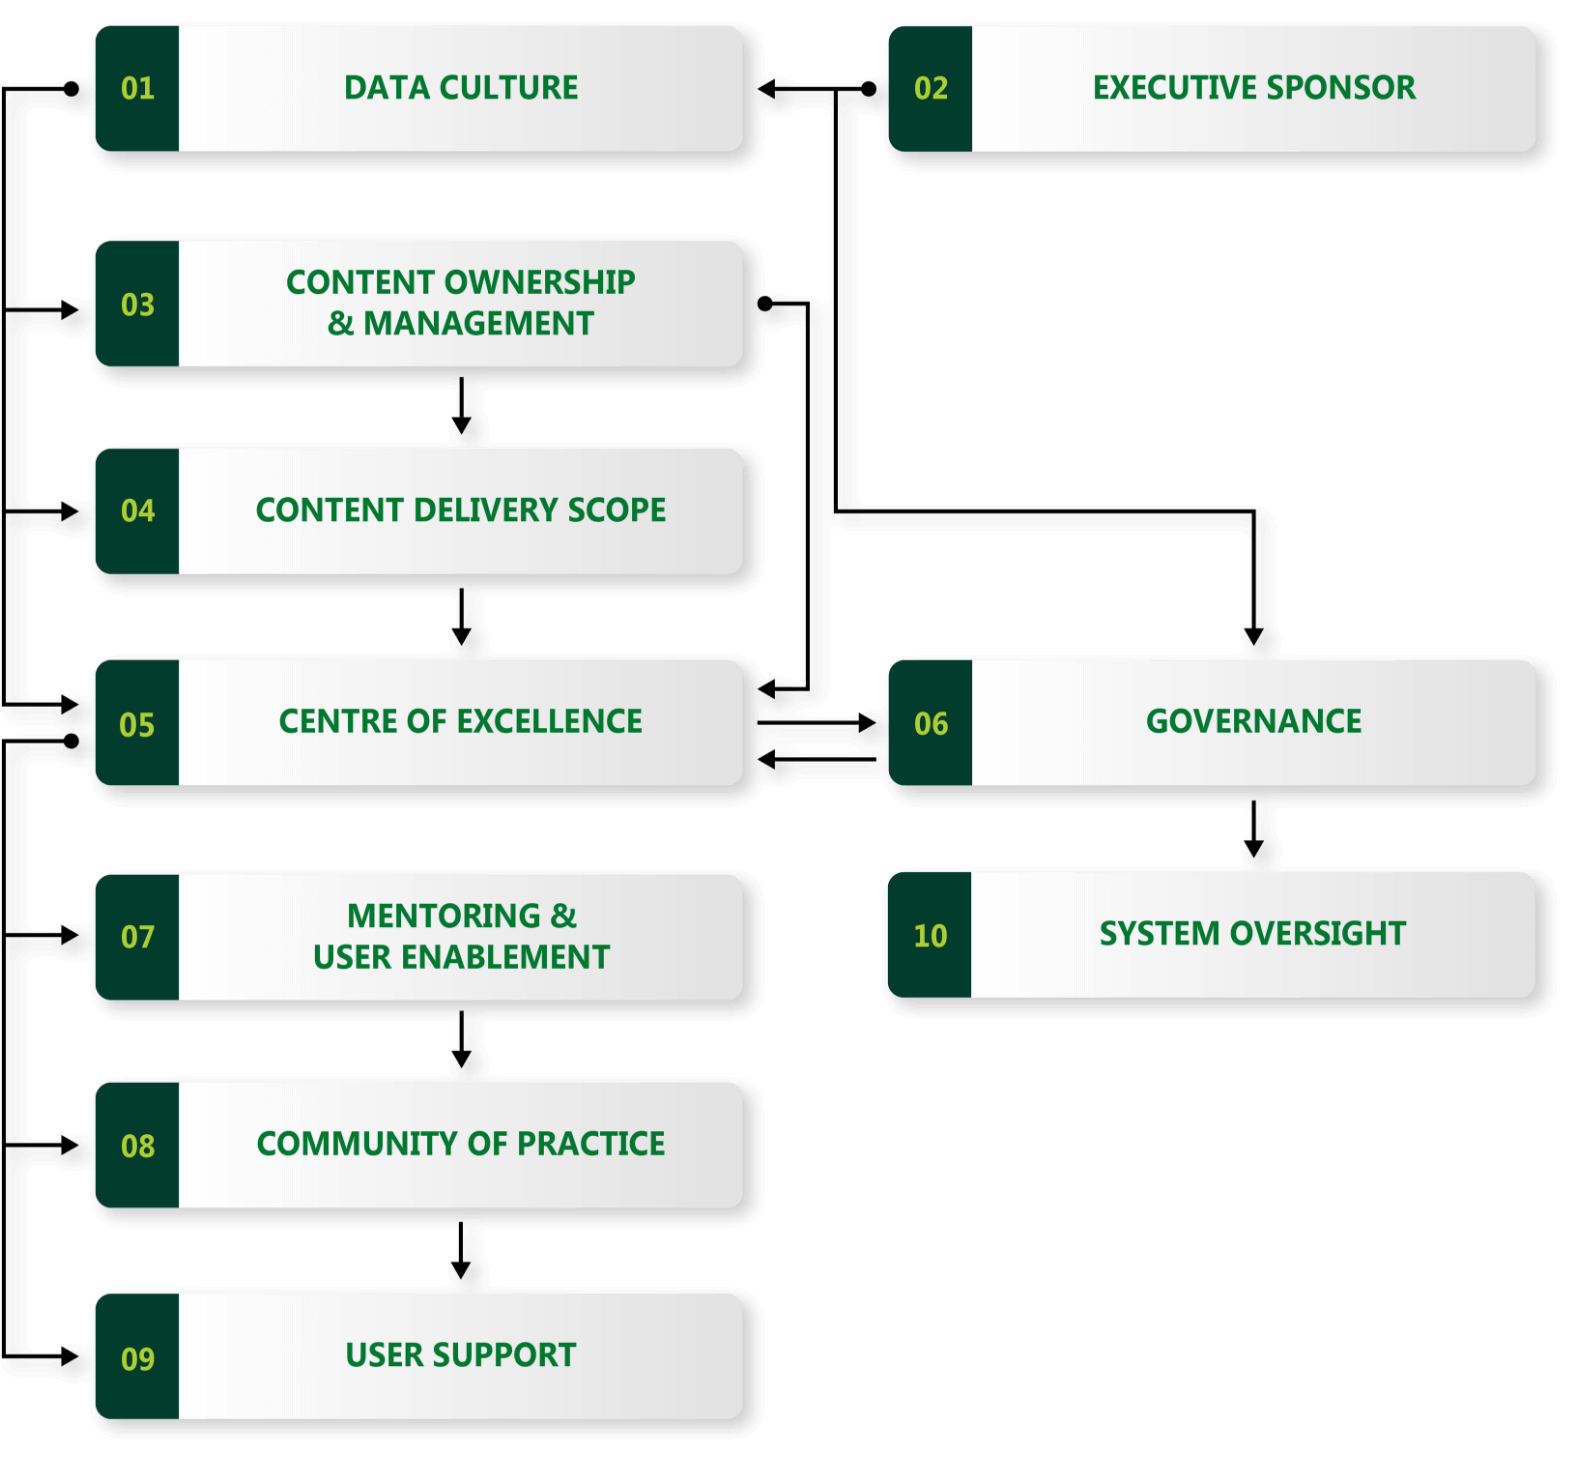
We closely align our approach for data visualisation to Microsoft’s recommended best practice. Successful deployment of a data visualisation solution, such as Power BI, requires disciplined planning and execution across a broad scope and realistic ongoing maturity assessments, highlighting progress made and targets to reach.
We can help you to:
- Assess the maturity of your current data visualisation programme and devise a plan to close gaps to best practice.
- Deploy a solution, such as Microsoft Power BI, including all your infrastructure, licensing and capability needs.
- Migrate from a legacy solution (such as Tableau or Qlik) to Power BI.
- Deliver proof-of-concept projects to demonstrate the benefits of data visualisation for your organisation.
- Develop organisation-wide capability, using our experience of innovative learning solutions coupled with our knowledge of data visualisation.
- Troubleshoot and fix your problems with existing data visualisation projects, including your data model designs

Benefits Delivered

- A culture of data-driven decision-making and empowerment through self-service.
- Automation of spreadsheet models and standardisation to a single visualisation and analysis platform.
- A single version of the truth and strong centralised data governance.
- Efficient collaboration, with colleagues working on the latest versions of reports and dashboards.
- The latest data available as needed, through real-time data feeds or automated refreshes.
Check out our resources…
Get our practical, no-nonsense take on business operations improvement and transformation insights, strategies, and solutions.